



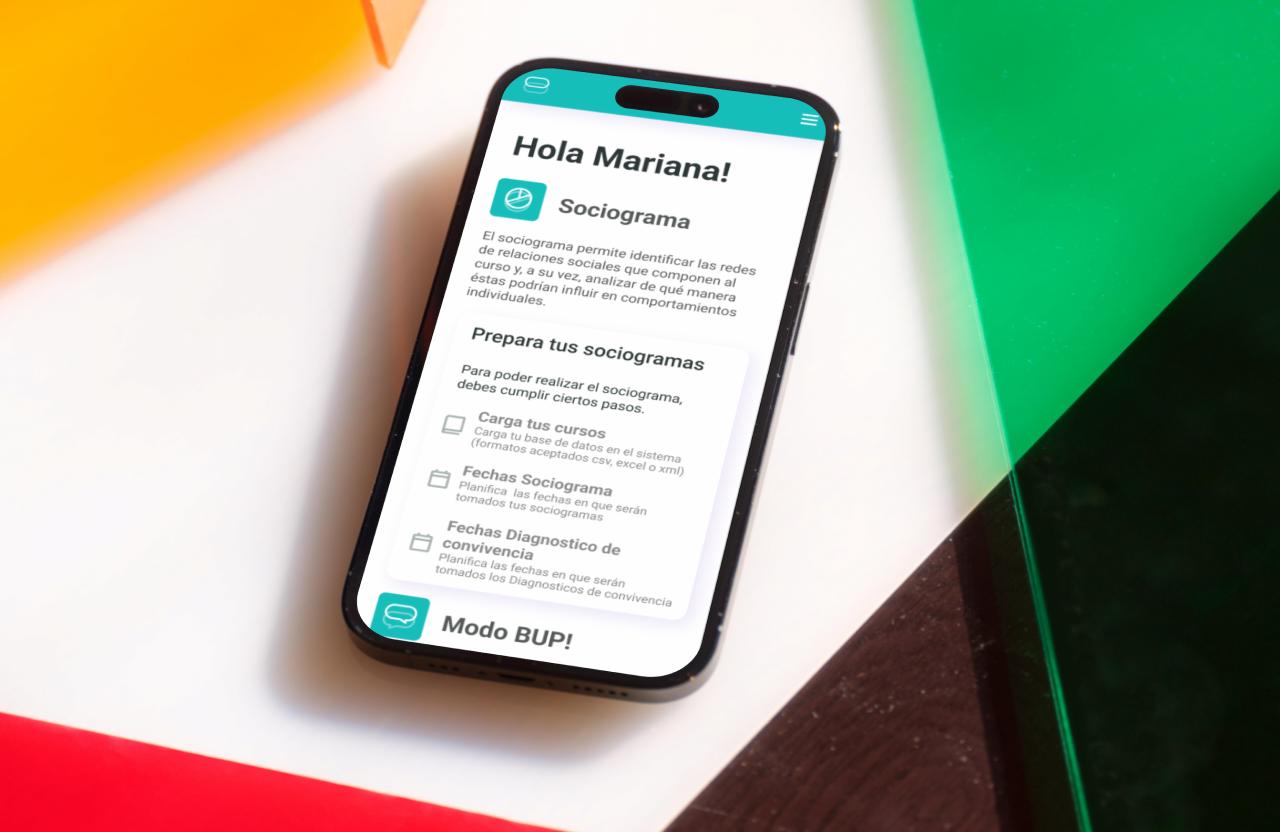
Brave UP! is an edtech platform focused on social-emotional learning. I joined as UX/UI and frontend developer, working across the design system, data visualization layer, and mobile feasibility prototypes.
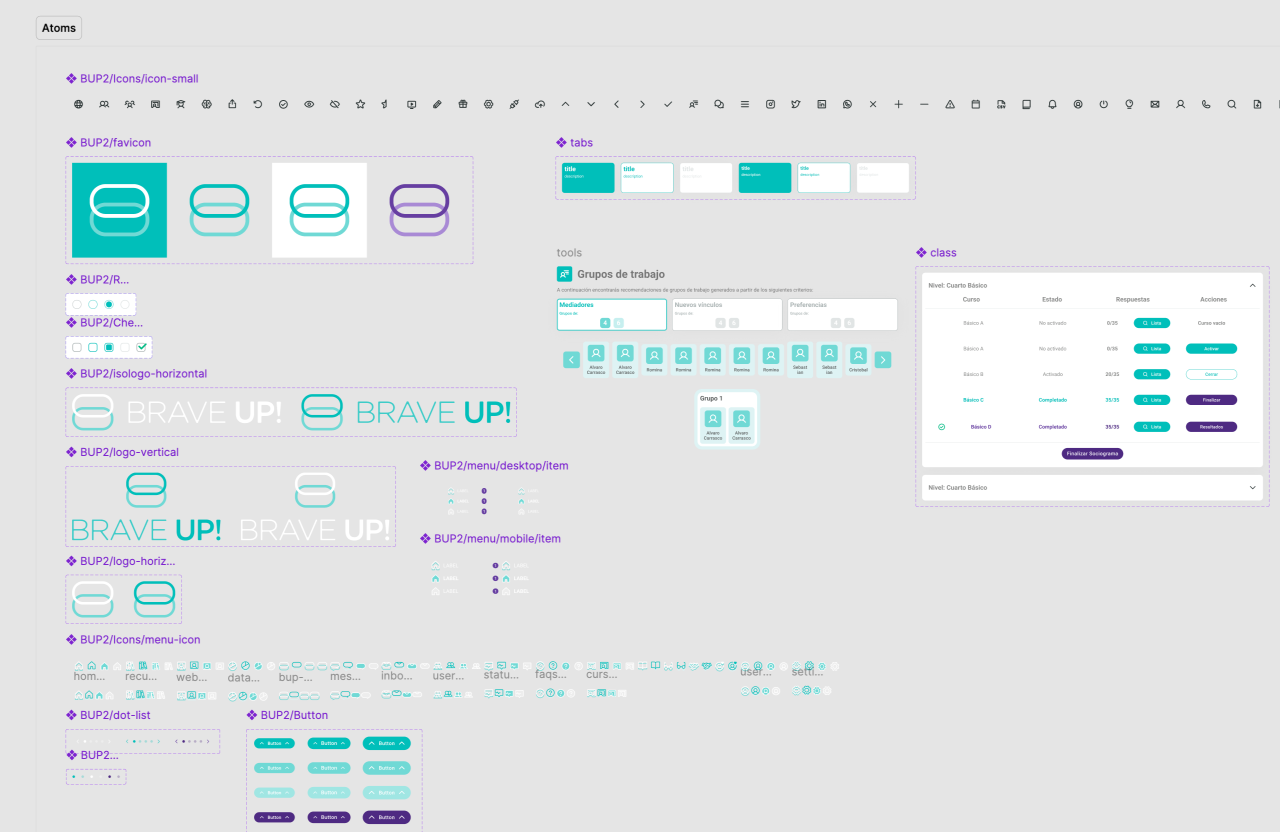
Design System
The design system was already in place when I joined. The work was making it scale. I standardized the SASS module structure across the codebase, resolved inconsistencies that had accumulated across multiple contributors, and improved cross-device compatibility throughout.
Data Visualization
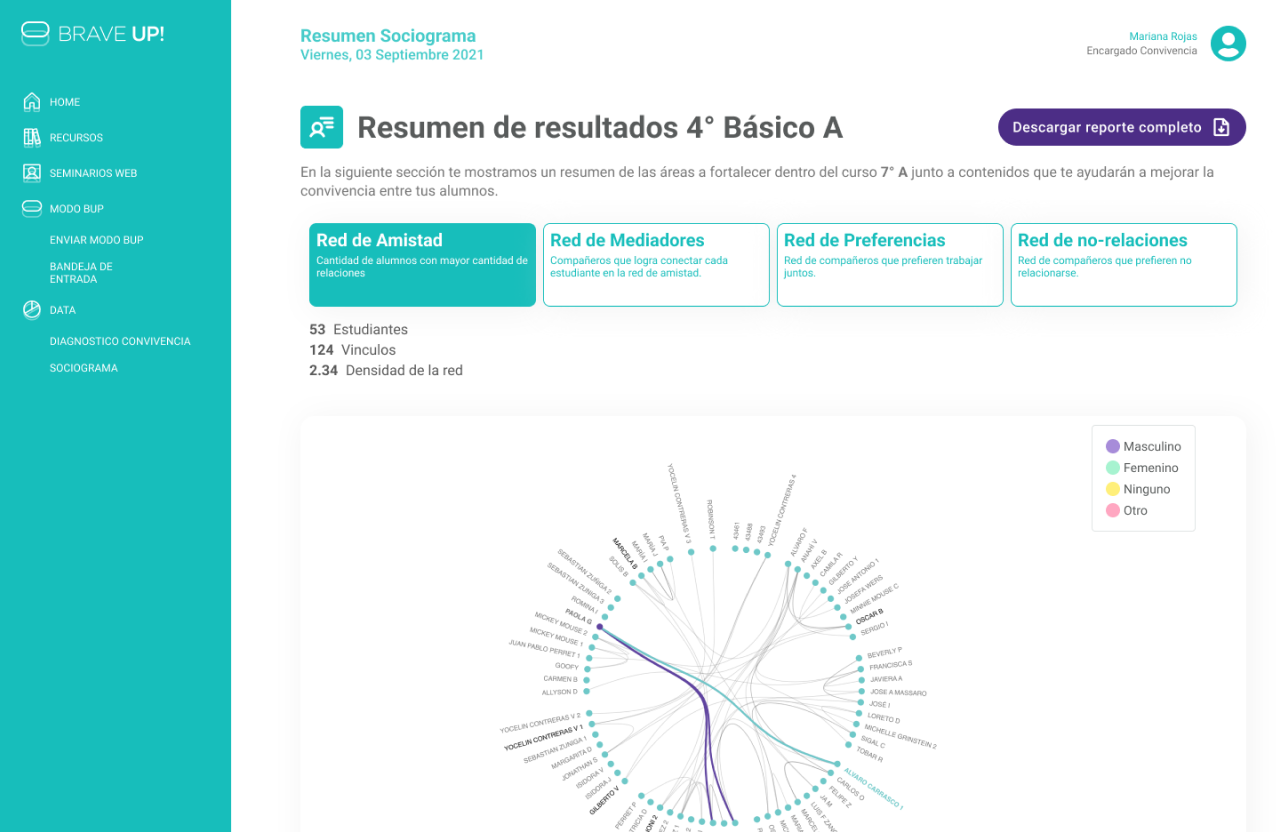
A significant part of the product was surfacing student and cohort progress through charts and dashboards. I implemented the data visualization layer using D3.js, translating complex behavioral data into readable, accessible charts for educators.
Design–Dev Bridge
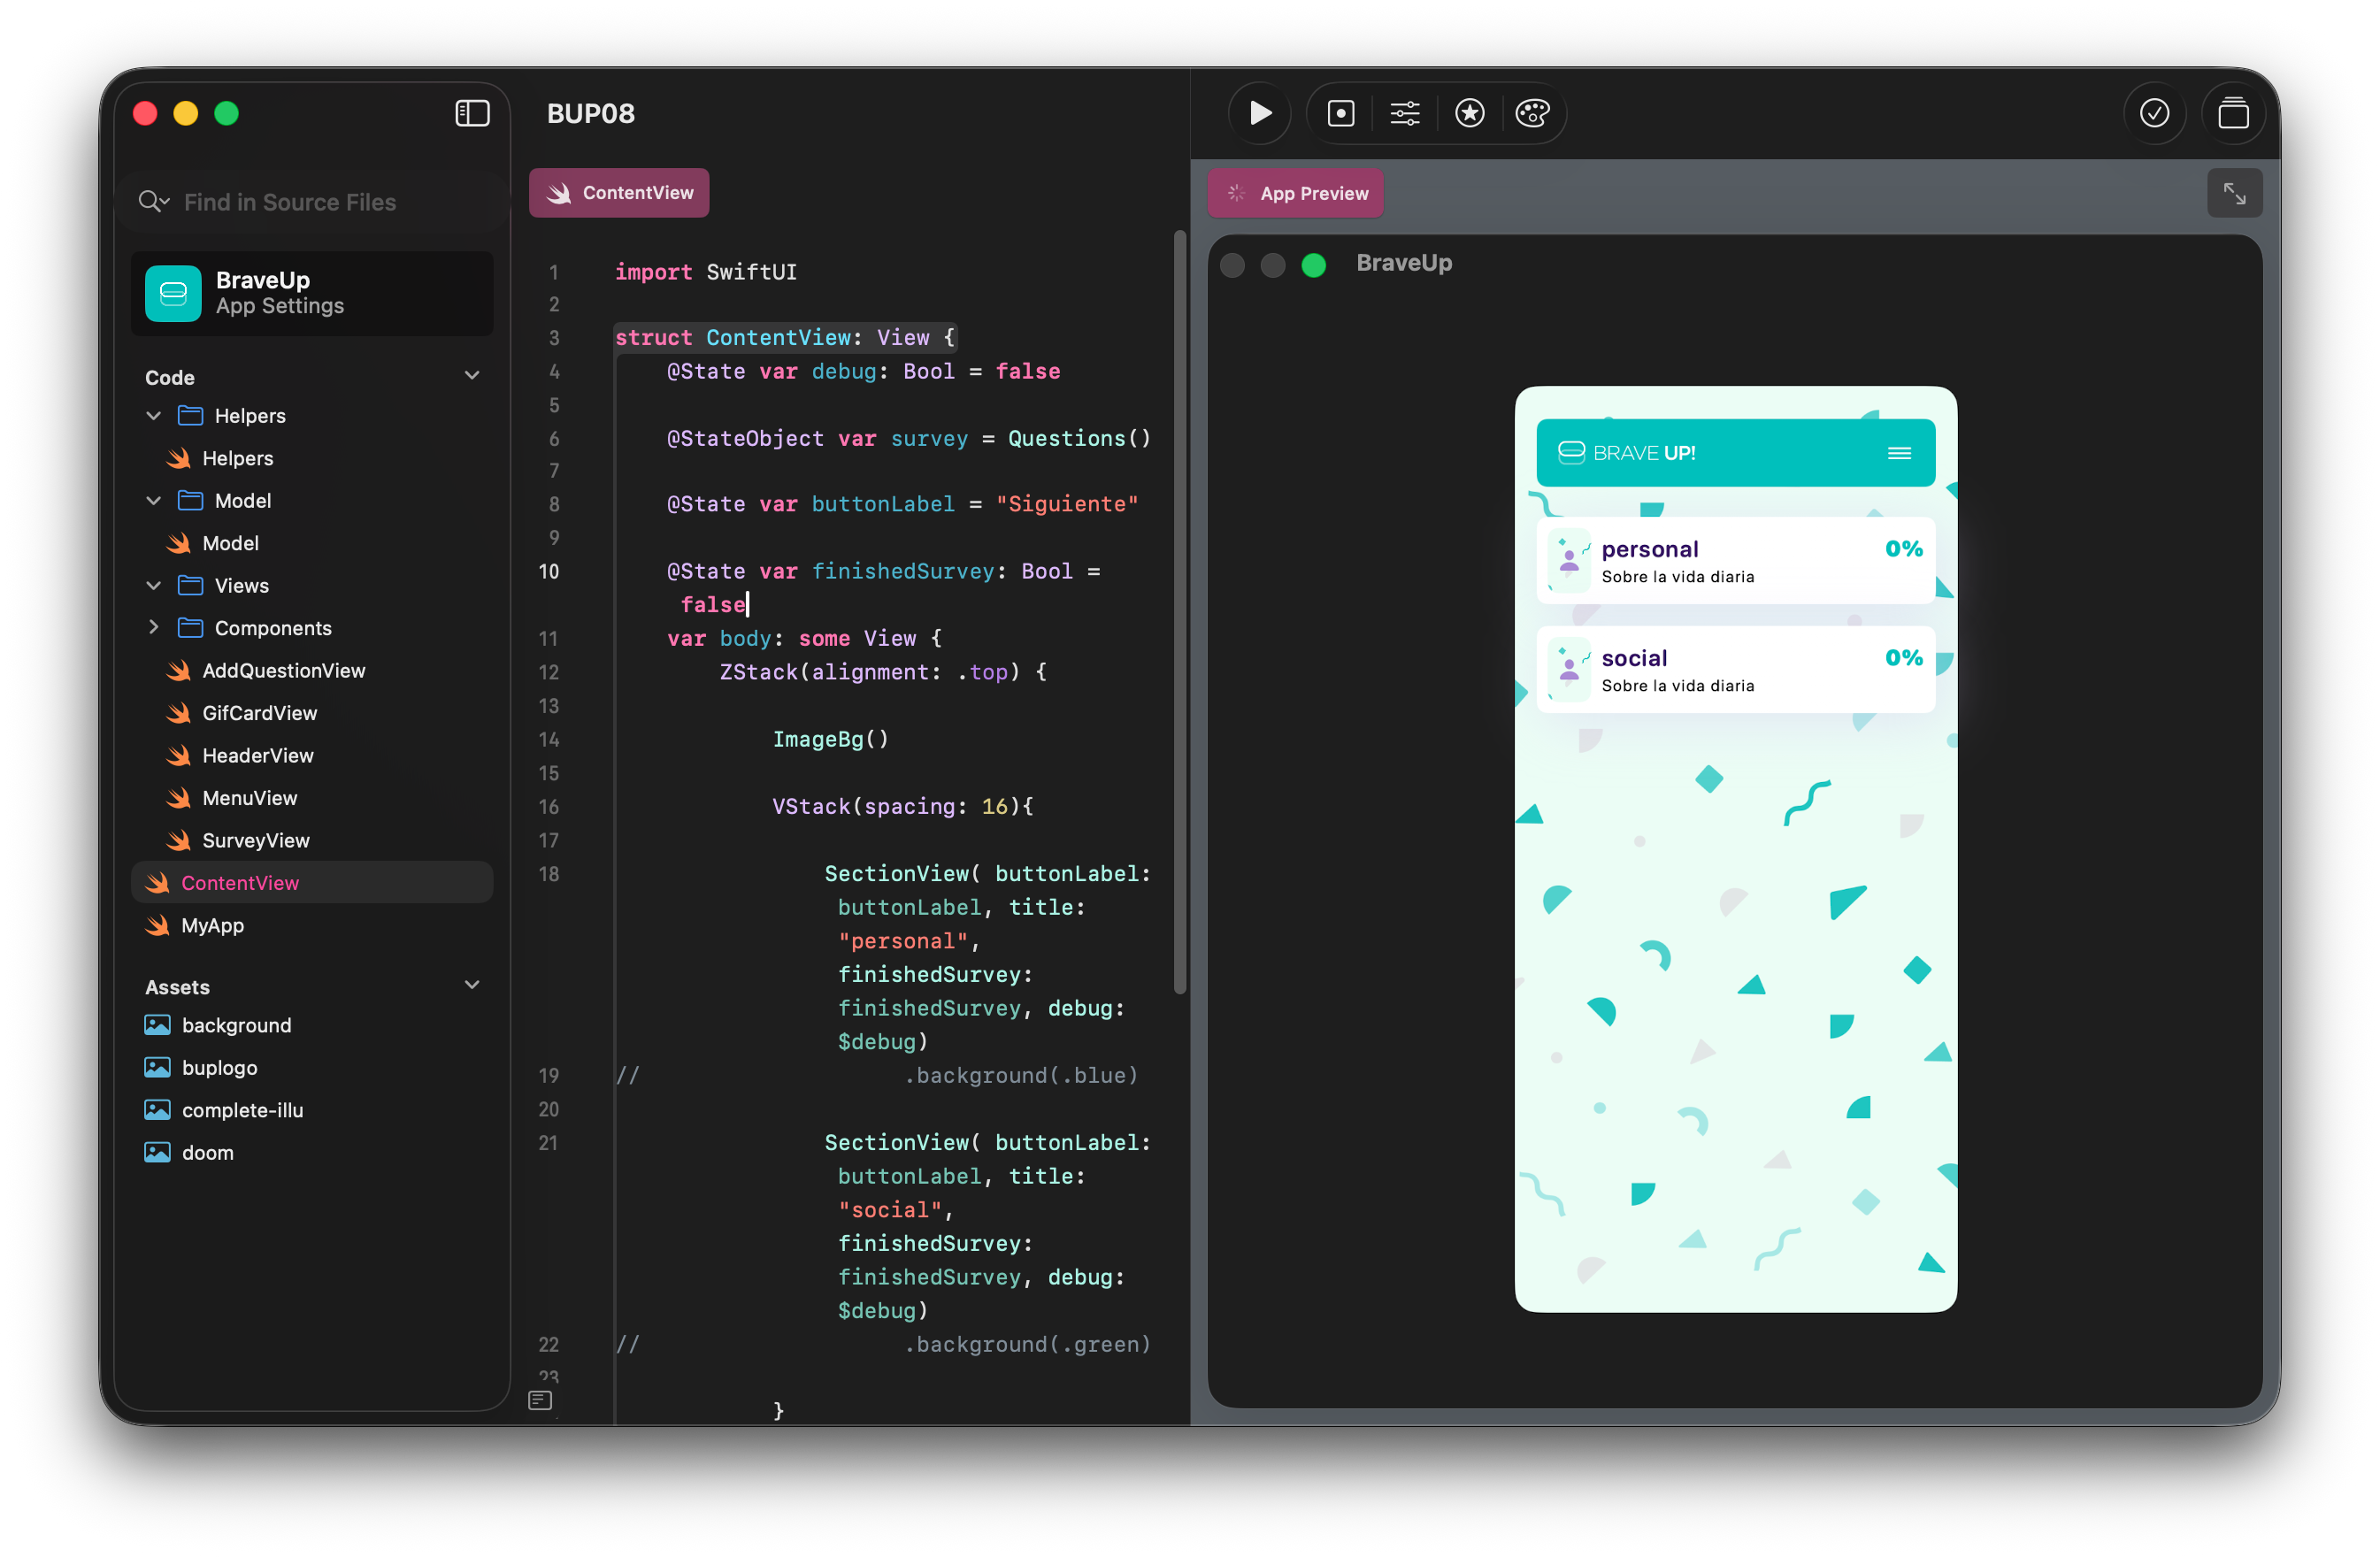
I built SwiftUI components to check whether proposed designs could actually ship. If something wasn’t feasible, I wanted to catch it before it hit the development sprint. I also reviewed the dev team’s code directly, checking for clarity, consistency, and compatibility before it went live.
Learnings
D3 is a rendering tool, not a design tool. Knowing D3 can render a chart doesn’t tell you what the chart should say. I had to learn data visualization as a discipline first, separate from the library. That shaped the design more than any API decision did.
Multi-timezone work has a real operational cost. The odd hours and constant availability aren’t just inconvenient, they’re a commitment. I’d factor that in earlier next time, before it quietly becomes the default.